How To Get The Difference Quotient Formula:
To Begin with, you should look at the graph below. It shows you a function with one point being (x,f(x)) and another point being (x+h,f(x+h)). Notice how there is a line drawn going through these points. This line is called a secant line. The difference quotient is really just the slope of this secant line going through point A and B.
The letter h used in the formula is really just delta x in a shorter way to write it.
The tangent line is found as the letter h, the distance between the first point to the next point, gets smaller. This is because tangent line does not go through the graph but only touches the surface of the function once. As the distance between the points reaches 0, it is closer to being a tangent line which represents the derivative of the function, which you want to ultimately find and be familiar with.
Math for Cheesebuckets
Tuesday, June 3, 2014
Monday, May 19, 2014
BQ #6: Unit U Concepts 1-8
1. What is continuity? What is discontinuity?
Continuity means that the function will be predictable, meaning it has no undefined points, no breaks, no "holes", and no jumps. To have a continuous function you must make sure that you can draw this function without needing to lift up your pencil from the paper. You also have a clue that you have a continuous function when the limit (INTENDED height) of a function is the same as its value (ACTUAL height).
You know that a function is at discontinuity when the limit is not the same as the value because the function has an undefined point, a break, a "hole", or a jump. At discontinuity, it is impossible to draw your function without needing to lift up your pencil from the paper at some point.
You must keep in that there are two families of discontinuity: Removable and Non-Removable.
2. What is a limit? When does a limit exist? When does a limit not exist? What is the difference between a limit and a value?
A limit is the INTENDED height of a function. It means that you are getting VERY CLOSE to a certain height as you are getting VERY CLOSE to a certain x-value. A limit differs from a value because as it is only the INTENDED height of a function, the value is the ACTUAL height of a function. For a value you do not just get VERY CLOSE to a certain height, you ACTUALLY GET there. If the function has the same limit and value it is a continuity, there is no ambiguity to it, but if the function has different limit and value then you know it must be a discontinuity.
Consider that there are two families for discontinuity. The limit exists only in the removable discontinuity, also known as the point discontinuity(it is the only one in that family), because the same height is intended to be reached from both the left and the right sides of a function. You put your fingers on both ends of the function,left and right, and you bring them together to meet at the same place, even if the place isn't there (point/"hole"). If they do not meet at he same place, then there is a non-removable discontinuity and the limit DOES NOT EXIST. The limit does not exist in 3 types of the non-removable discontinuity family. One is called jump discontinuity (the limit DNE because of different left and right); another is called infinite discontinuity (the limit DNE because of unbounded behavior); and finally there is oscillating behavior (the limit DNE because there is not definite point that is reached at a certain x value).
3. How do we evaluate limits numerically, graphically, and algebraically?
a) Numerically- For instance, the picture below shows the table needed to find limits numerically. If finding the limit as x approaches 3 (#9), we would plug the function of #9 into our calculator at "y=", we would hit "graph" and "trace" for the numbers getting VERY CLOSE to the x-value 3. Our table like shown below will help us organize our information. In the middle box for the x value (on top if the ?) we would put the 3. The 3 boxes on the left should be the x values getting VERY CLOSE to 3 from the left side--2.9, 2.99, 2.999--and the 3 boxes on the right should be the x values getting VERY CLOSE to 3 from the right side--3.1, 3.01, 3.001.
https://drive.google.com/file/d/0B4NSkh2FgPbXR2RSOUU0cFVvWWs/image?pagenumber=6&w=800
b) Graphically- You just take a look at a graph like the one shown below and write down what you see happening in terms of the limit at each x value you need to take a look at.
https://drive.google.com/file/d/0B4NSkh2FgPbXR2RSOUU0cFVvWWs/image?pagenumber=5&w=800
c) Algebraically- There is direct substitution, in which you plug in the x value directly to the function to get the limit. You can get 4 different types of answers. There is numerical answer (ex. 3)...YAY we are done! There is a answer with a 0 divided by some number, which equals 0...YAY we are done! There is an answer when a number is divide by 0, which we know is undefined, and therefore the limit DNE...YAY we are done! Finally there is a 0 divided by a 0, which means that it is "not yet determined" and you must keep working on another method to figure it out. Note: remember 0/0="hole"
Another method is dividing out/factoring. IF you try direct substitution and you get a 0/0, then you may move on to factoring out a polynomial, from whichever numerator or denominator as needed, and get rid of the zeroes. Then you use direct substitution on whatever is left after getting rid of the zeroes.
The last method is called rationalizing/conjugate because if you have a square root in either the numerator or denominator you must multiply by its conjugate to cross out the zero. Once again you must consider this only if you have definitely tried the direct substitution method first and you got 0/0.
Monday, April 28, 2014
Reflection #1: Unit Q
#1. What does it actually mean to verify a trig identity?
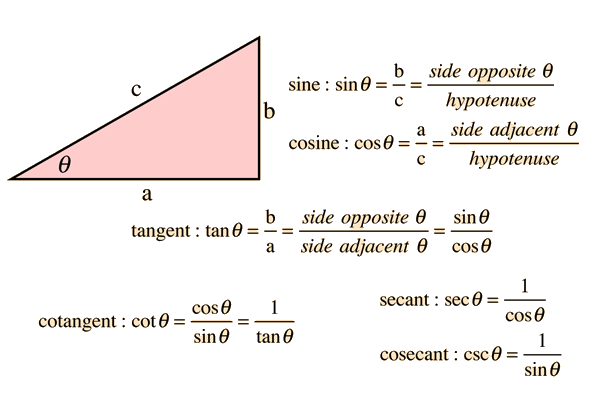
You show that the Pythagorean Theorem is correctly used in the triangles to find sine and co-secant, cosine and secant, and tangent and cotangent. For example, if you are given sine=3/5 you know that cosine must equal 4/5. You get the 4 from the Pythagorean Theorem 3^2+b^2=5^2; b=4. Meanwhile, you show that you get the the 5 as the denominator as well as the c value in the Pythagorean Theorem because we know that sine is S-O-H, opposite/hypotenuse and cosine is C-A-H, adjacent/hypotenuse. Also, tangent is T-O-A, opposite/adjacent. ( Soh cah toa is use for right triangles only).
To better visualize the concept, please take a look at the images below:
http://www.mathwarehouse.com/trigonometry/images/sohcohtoa/sohcahtoa-all.png
http://hyperphysics.phy-astr.gsu.edu/hbase/imgmth/ttrig.gif
#2. What tricks and tips have you found helpful?
I found that knowing the trig identities out of the top of your head was really helpful. However, there is no shame in not being able to memorize them quick enough or at all. I do think is better if you do know them because then you are more familiar with the concept and you have a better idea of how to get where you want to get. I suggest you do Mrs. Kirch's blog posts with thoughtfulness and to practice as much as possible and to ask questions. I also remember having problems in which knowing how to factor pretty good will help you a lot in simplifying or verifying.
#3. Explain your thought process and steps you take in verifying a trig function. Do not speak in specific manners, but speak in general terms of what you would do no matter what they give you.
My thought process would be:
- can I substitute an identity?
- can I use ZPP?
- are the numbers in the problem familiar with unit circle numbers?
- do I have to Square anything?
- does it deal with fractions?
- -
Friday, April 18, 2014
BQ #4: Unit T Concept 3: Graphing tangent and cotangent
To understand why "normal" tangent graph is uphill, but "normal" cotangent graph is downhill, you must understand how each is applied in the unit circle. Tangent is sine over cosine. Cosine is 0 at 1/2 radian and at -1/2 radian so this determines where the asymptotes are placed. According to where the asymptotes is how the graph is formed. For instance -1/2 radian comes first then 1/2 radian and quadrant 4 and 1 are in between. In quadrant 4 tangent is negative so it goes below and in quadrant 1 tangent is positive so it goes above.
Cotangent is just above, below because the asymptotes end up in different places since cotangent is cosine over sine and sine is 0 in 0 radian and 1 radian.
BQ #3: Unit T Concept 1-3: Graphing sine, cosine, cosecant, secant, tangent, cotangent
The above pictures show the relation between sine and cosine with all the other trig function graphs. Notice that sine and cosine graphs are similar in the way they swingle continuously. In contrast to the other graphs, which obtain asymptotes and do not continue in the way that sine and cosine do. Those rest of the trig functions that have asymptotes go on forever in a vertical way. In Mrs. Kirch's words, those trig function graphs require us to raise our pencil to continue to outline the rest of the graph.
You are recommended to go to desmos.com in order to have a full experience on how different values affect the graph.
Thursday, April 17, 2014
BQ #5: Unit T Concept 1-3: Graphing sine, cosine, cosecant, secant, tangent and cotangent
Sine and cosine do not have asymptotes, meanwhile all the other trig functions have asymptotes. But, why? Remember that an asymptote forms when there is an undefined ratio/fraction. This means that there is a number divided by 0.
This is based on the trig function's ratios. Sine and cosine have ratios of y/r and x/r. "r" always equals to one in the unit circle so we can be sure that the ratio will never be undefined.
Meanwhile, the ratios for all the other trig functions have a denominator, not of r=1, but of either y or x values, which could happen to be values of 0.
BQ #2: Unit T Concept 1-3: graphing sine, cosine, secant, cosecant, tangent, and cotangent
Trig Graphs relate to the Unit Circle. We must consider the fact that in trig graphs, the Unit circle is expanded into a line form, instead of a circle form, in order to make sense in a graph.
*A period means the graph goes through one cycle while covering certain radian units on the graph. An amplitude are half the distance between the highest and lowest point of the graph.
*Periods.
For instance, sine, cosine, cosecant, and secant have a period of 2 radians. This is because it contains a 4 part repeating unit all the the way around the unit circle (360 degrees=2 radians). This is shown in the unit circle when we look at the pattern of where the sine and cosine are positive and negative.
Sine is positive on Quadrant I and II and negative on Quadrant III and IV. The pattern is positive positive negative negative. And it continues, but we must realize we had to go all around the unit circle in order to continue the pattern. The same with cosine, whose pattern is pattern is positive negative negative positive. The pattern continues but only have we went around the unit circle. Again, around the circle means it is 2 radians.
In contrast with tangent and cotangent, which have a period of only 1 radian. This is because they only have a 2 part repeating unit which just reaches half way through the unit circle at 180 degrees=1 radian until it repeats again. The pattern is positive negative positive negative all around the unit circle. There was one repetition in pattern so the pattern continues every 1 radian.
*Amplitudes
Sine and cosine have amplitudes because they are the ones with the restriction: -1<sine or cosine<1. This means that their highest point is 1 and its lowest point is -1. Relating to the unit circle, we know that the lowest it goes it to -1 and the highest it goes is to one (remember a unit circle has a unit of 1 all around) The sine an cosine ratios are y/r and x/r. The highest the y and x values could be is 1 and the lowest they can be is -1. ("r" is the ration equals to one).
The other trig functions instead go up forever or down forever because they do not have restrictions.
Subscribe to:
Posts (Atom)